Gradebook Analysis
Creating a gradebook based on students' individual grades.
- python
- da
Last modified:
Research Question
Data Sources
RealPython data
- Roster
- Homework & Exam grades
- Quiz grades
Progress & Findings
- Inconsistencies can be found within the data
- Students’ names are represented differently in each table
- The email addresses stored have different elements, some emails are not formatted as
first.last@univ.edu - The data is sorted differently in each table
- Missing data is present across the different tables
- Clean and structure the data for analysis
- Handle missing data
- Each student’s data is contained within a single observation in the data table, which means that the number of observations is equal to the number of students in the class
- The features required for the data analysis are homework score, quiz score, exam score, name, and UUID
- Calculations and the final letter grade is to be stored in separate features
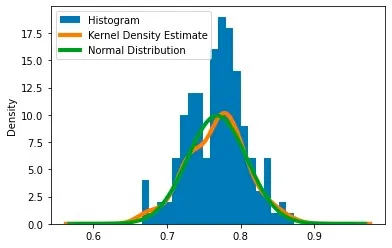
- Plot the grade distribution
- The vertical axis shows the density of the grades in a particular bin
- The peak density occurs in approximately 0.78
- Through the plot, it can be concluded that the density estimate and normal distribution matched the data well
Conclusion & Future Work
- Through this simple exercise, I was able to learn to use Pandas for purposes such as:
- Loading data
- Cleaning data
- Merging data
- Calculate with DataFrames and Series
- Map values
- Plot using Pandas and Matplotlib