K-Means Clustering Housing and Image Compression
Apply K-Means clustering to analyze housing data and separately conduct image compression.
- python
- ds
- ml
Last modified:
Description
In this project for Intro to Machine Learning with Applications class by Dr. Liang , the primary task is to apply k-means clustering to analyze housing data, with a side-task of conducting an image compression. The process involves utilizing k-means clustering, an unsupervised machine learning algorithm, to group similar instances based on certain features.
Framework
- Problem definition
- Data
- Evaluation
- Features
- Modelling
- Experimentation
Research Question
Data Sources
Features
- longitude
- latitude
- housing_median_age
- total_rooms
- total_bedrooms
- population
- households
- median_income
- median_house_value
- ocean_proximity
Progress & Findings
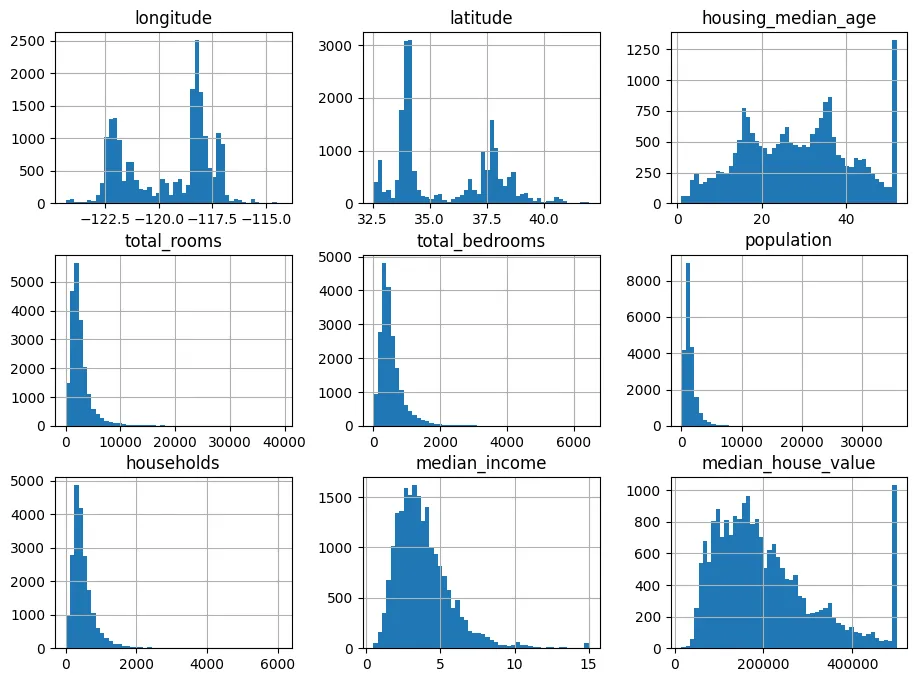
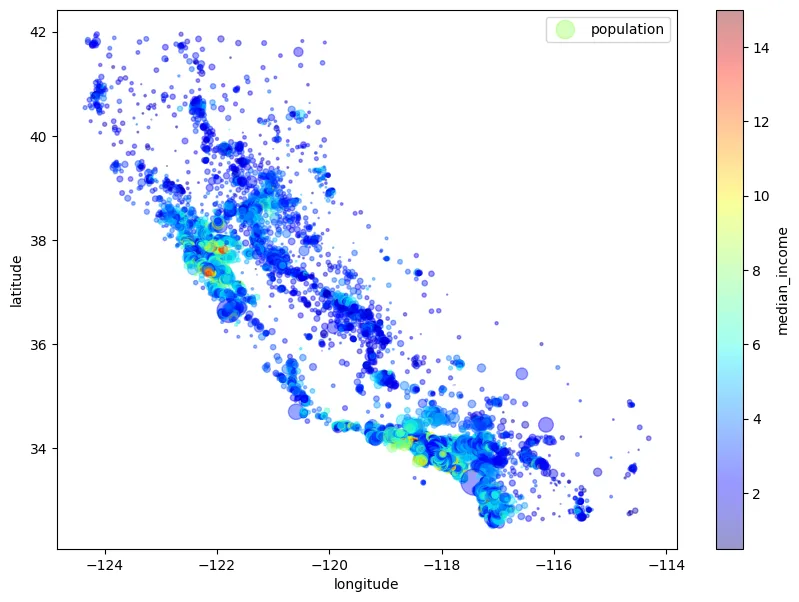
After inspecting the data, there seems to be missing values in the total_bedrooms feature. The missing values are not handled since total_bedrooms feature is not used in this project. The first figure below displays the histogram of all the numeric features of the data which shows the distribution of each of the features. The figure to the right shows a plot of the population (denoted by the size of a point) and median income (denoted by the color of a point) by the location of the housing. These figures give a general sense of the data in hand.
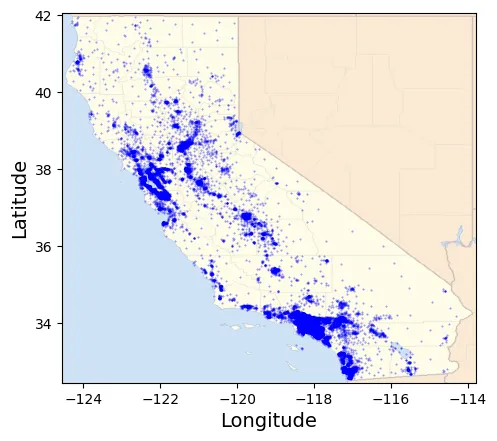
*This figure is a dot map that plots the data points in California based on its location. It highlights housing areas in California with higher number of people. *
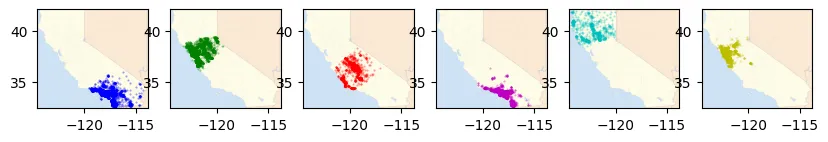
The figures below visualize the clusters of data points based on locations to reveal spatial clusters using K-means clustering.
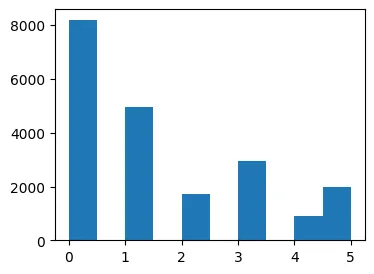
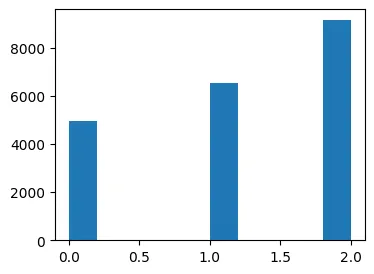
Again, using K-means clustering, the data points were clustered and visualized, revealing six different clusters based on where people live based on their income level.
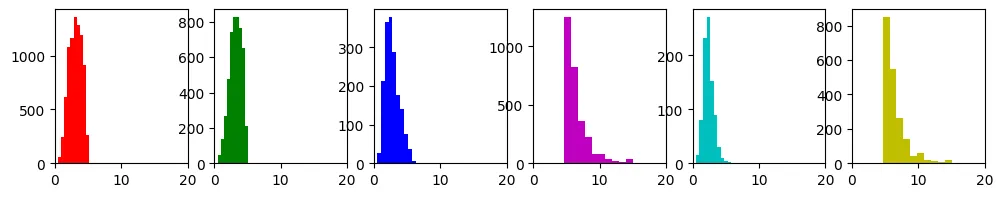
The histograms of median_income in each cluster.
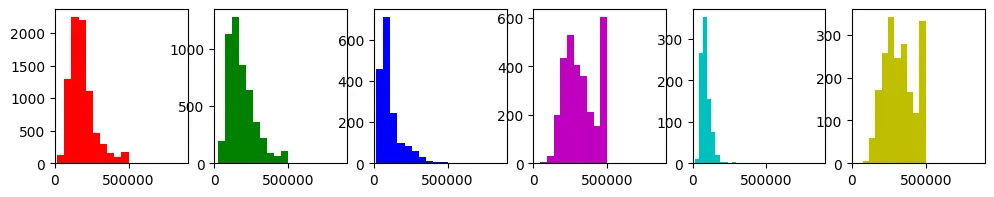
The histogram of median_house_value in each cluster.
Side-task: Image Compression
Steps
Step-0: read an image from a bmp file
Step-1: prepare the data matrix X
Step-2: perform k-means on data matrix X
Step-3: compress the image using the cluster centers
- Make a copy of the the data matrix X, call it Y
- Then, modify the data matrix Y, such that every data point is replaced by the corresponding cluster center
- Convert the data matrix Y back to an image Ic
Step-4: visualize the compressed the image Ic
Step-5: save the compressed image to a bmp file
Conclusion
The analysis of housing data using K-means clustering has shown interesting connections between people’s incomes and where they live. One surprising finding is that some people with low incomes live in expensive houses, pointing to possible economic inequalities in certain neighborhoods. On the other hand, the identification of specific groups of well-off individuals helps us understand where the higher-income individuals tend to live. This project not only reveals these living patterns but also highlights how looking at housing data can teach us more about the complex relationships between income and living arrangements. It provides a deeper insight into the dynamics of money and living situations in different areas of California.